

SCAD Animation Studios recruits students to work on a project that reflects the studio experience by collaborating with students from a variety of majors.
This project takes on the challenge of creating an animated series to teach preschool-aged children how bread is made.
For this project, I used a mixture of Google Sheets and ShotGrid. Google Sheets was mainly used for tracking assets and shot completion. ShotGrid was mainly used for dailies, tracking notes, and versions.
*Please note that ShotGrid was down for our school during the pre-production period.
All art is owned by SCAD Animation Studios
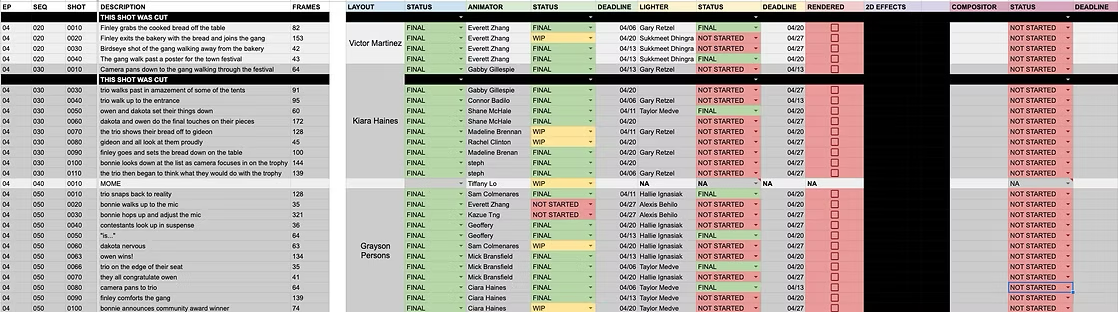
For shot lists, I followed the naming conventions that the Technical Director requested.
My executive producer requested that the layout of the shot list show all departments from start to finish.
To keep track of what shots were being rendered, who was rendering, and when they began and finished, I created this spreadsheet to keep track of all progress during the day.
Specifically, I made functions that would calculate:
Percentage of shots completed
Number of shots left rendering
Timestamp for the start and completion times
To help keep track of those who are enrolled in the class and/or actively participating in the production, I created a detailed roster to help keep track of crew members’ activity.
This was the first sheet I created for the project!
Challenges
This was my first time leading an animation production, and a lot was learned during this time. All my takeaways from this experience have helped me become stronger for future projects. This was such a wonderful group of artists for my first producing experience, and I am happy to share that I still work with many of them post-graduation.
Managing a group of 70+ artists
Adapting to production setbacks while maintaining a high morale
Learning how to use Google Sheets and ShotGrid and integrating it into animation production